


Stocks are sending a sell signal.
So says widely followed strategist Sven Henrich, founder and lead market strategist at NorthmanTrader, who told CNBC's "Fast Money" on Thursday that one S&P 500 chart is showing the market heading for a major drop.
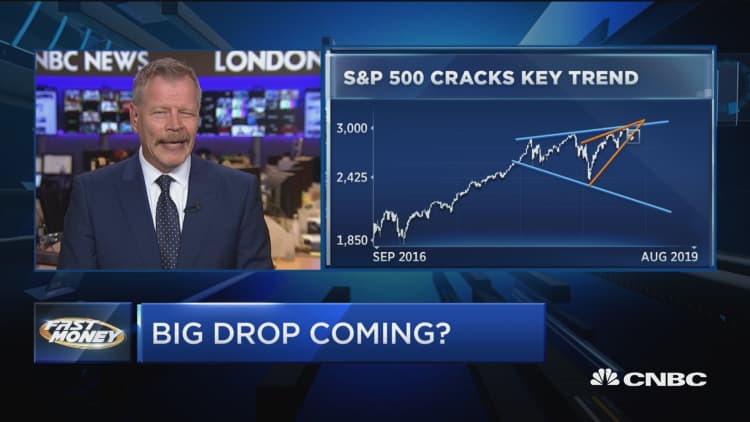
Many market watchers have taken notice of the technical "megaphone" pattern the S&P has been forming since mid-2018, a formation made during times of heightened volatility that is also known to some as a broadening wedge.
Digging deeper, Henrich discovered a new element forming within the megaphone: a rising wedge. Technical analysts use rising wedges to try and predict trend reversals in a given security.
"What happened in August is that rising wedge actually broke to the downside," Henrich said. "That's kind of your ... classic warning sign. And so markets will have to repair that, or face risk of further downside to come."
To "repair" the trend, in Henrich's book, the S&P would have to break above the upper trend line of its megaphone pattern, make that trend line its new floor of support and then, potentially, enjoy a "massive rally."
But there's still a lot of room for error, the strategist warned.
"What we're looking at here short term is there's a possibility the VIX goes up to 28-30" in the coming months, he said, referring to the CBOE Volatility Index, also known as the stock market's "fear gauge."
"There's currently a pattern on the VIX that suggests that is a distinct possibility. We may have a buyable dip," Henrich said. "Otherwise, with a break of 2,700, for example, you're starting to risk that this pattern goes active. And the ultimate target [on] that one is 2,100."
That would represent a nearly 28% drop for the S&P from its Friday levels. And while that sounds dramatic, Henrich said the market is actually already offering some support for this theory.
"Ironically, that's kind of what the bond market's been signaling. The 10-year [U.S. Treasury yield is] already back to the levels of the U.S. election in 2016," he said. "You have nine major economies around the globe already either in recession or at the verge of a recession."
That's what's been causing the increasingly "violent" swings in the stock market, and the longer the U.S.-China trade debacle drags on, the riskier the environment gets, Henrich warned.
"I think the market is getting impatient," he said. "The market wants this resolved, and to the extent that this, again, gets pushed into next year, perhaps, I think markets will lose patience as we see Europe, for example, overtly flirting ... with recession at this point."
Worse, if global central banks continue to "intervene when markets [get] into any sort of trouble" with accommodative monetary policy, their ability to step in during a full-fledged crisis may become muted, if not ineffective, Henrich said.
"The Fed actually is cutting rates here with financial conditions being the loosest in 25 years. It's unfathomable. When you have loose financial conditions, typically, central banks raise rates," he said. "What are they trying to accomplish here by going even looser than what we've seen before?"
"Look at the housing data you're getting with mortgage apps," he said. "With yields collapsing, the 30-year making all-time lows, we don't really see any growth here in the housing market. So, what's the end game here in terms of efficacy? And I worry that, obviously, we are reaching a point where central banks can only do so much."
Correction: This story has been updated to reflect that the pattern forming in the S&P 500 chart is a rising wedge.